The Audit Database was a widely used tool in the IT Service Center. I was not the one who made it, it was in place by the time I got on the management team, however, I adopted it and improved upon it during my time as a manager.
All of our documents that we worked with were made in Google Sheets as our enterprise mostly ran using google suite applications. This sheet had many tabs that we used to keep it organized (which can be seen below), the main ones being the front page, monthly ticket population, quizzes, and by the end announcement tracking.
Below the “tabs” picture is a breakdown of each of the columns and the formulas they use.
Tabs
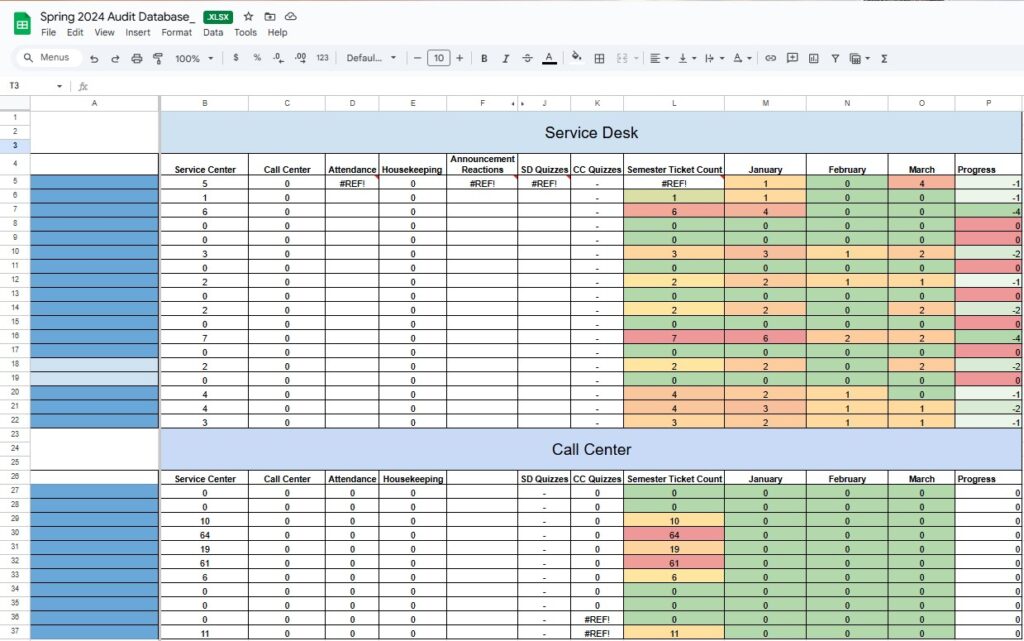
On the front page Column A contains the names of all of our employees, they have been removed for privacy.
Column B uses the COUNTIF function to count how many times the name in column A of the associated row appears on the tab “Service Desk”; which below is shown to contain completed ticket audits.
Column J uses the IMPORTRANGE function to pull data from specific cells of another tab. While this other tab is in the same sheet, this is the easiest way I found to import an array.
Columns M, N, and O use the VLOOKUP function to find a specific value within an array. The first variable takes a value and searches for the row containing that within the defined array. The array is defined by the second variable ‘January!$C$5:$K$36’. This defines the tab that will be searched and the array of columns and rows. The third variable in the function defines which column of the array we want to lookup. With these 3 variables together, we pull a single data point to display in the relevant cell that this formula is in.
Column P is a simple formula that takes the difference between the most recent two months to show if an employee is improving or not.
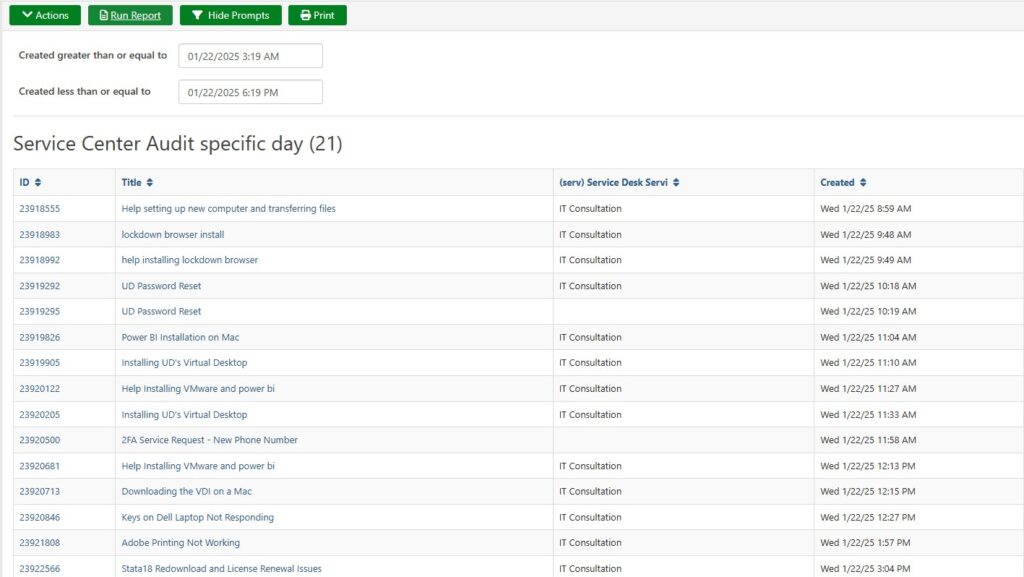
Audits were performed as a method of quality assurance. Our service center used TeamDynamix (TDX) as our ticketing platform. Using the reports feature of TDX we generated a report of all tickets made each day and audited them for QA.
If a ticket needed to be better, it would get an “audit”. The first tab (above) displays the total number of audits, the total number for the most recent 3 months of the semester, as well as a progress column, showing if an employee was improving or regressing.
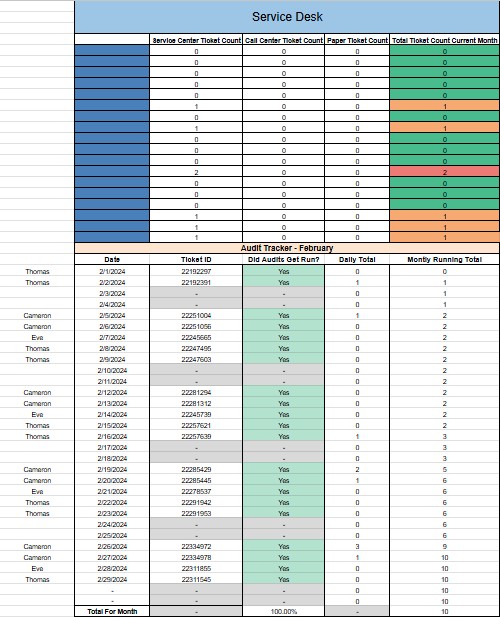
Each month was also given its own tab, this is how the data for the monthly columns was pulled. This sheet uses lots of formulas in order to function correctly. The monthly tabs have a counter to see if audits were run that day or not, it was the job of the auditors to fill in the day they were responsible for with the audit ticket they created showing they completed the audit for that day.
The “area” tab (Service Desk / Call Center) is where the audited tickets populate. There is a google form that the auditors fill out which populates this tab of the Audit Database google sheet. The areas can be seen in the “tabs” picture above and an outtake from this page is below.
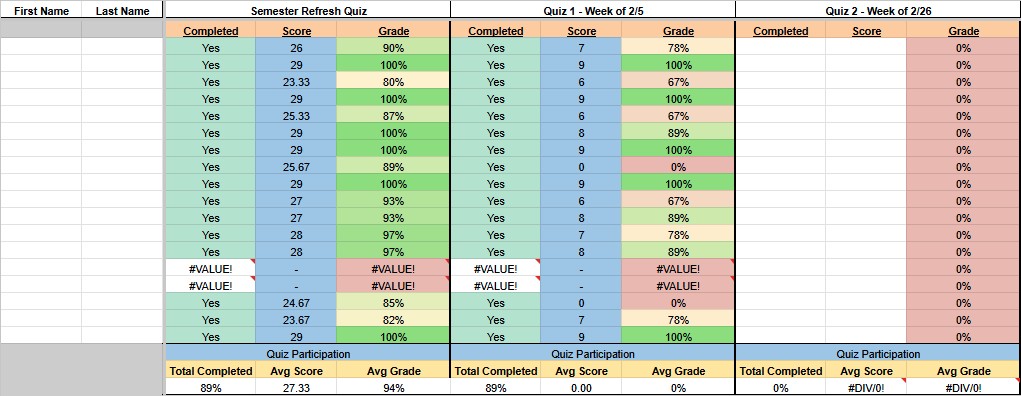
Finally, the quizzes tab was one of my contributions to the document. I developed this during my time as Service Desk Training Lead. While it is not automated like the other google form tabs, this one keeps track of whether or not employees completed the biweekly quizzes and how well they did on them.